Web Scraping
Webscraping is the process of extracting information from a web page or multiple pages and using that information for some other purpose or analysis. It can be used to aggregate and summarize information. Here, we’ll show how to use web scraping to obtain information from two different websites.
One thing to note is that many website have terms of service that explicitly forbid web scraping entirely, and some limit the number of requests you send them. Please carefully evaluate any web page you scrape for any rules and regulations they have.
Processing HTML with requests and BeautifulSoup
We’re going to start with standard web scraping. We’ll import
requests and BeautifulSoup.
requests is used to make HTTP requests to urls. HTTP requests allow
communication between a server (where a website lives) and a client
(e.g. your browser). In our case, the client is the code we’re using
from the requests library.
BeautifulSoup is used to process HTML. HTML is the language that is
used to structure web documents. It defines what goes where on the page
and to some extent the style of objects on a page. BeautifulSoup
allows us to navigate HTML and extract useful information from it.
import requests
from bs4 import BeautifulSoup
We are going to scape a web page designed for scraping: https://www.scrapethissite.com/pages/simple/
This page includes some information about different countries in a tabular format.
url = 'https://www.scrapethissite.com/pages/simple/'
To retrieve information from this page, we are going to use
requests.get(). This function uses the HTTP command GET to
retrieve the information from this URL.
# Get data from the URL
data = requests.get(url)
data
<Response [200]>
This response code means that we successfully retrieved the page. That
means that we can retrieve the HTML of the page by using the .text
attribute. We’ll then look at the first 1000 characters of the page’s
html.
html = data.text
html[0:1000]
'<!doctype html>\n<html lang="en">\n <head>\n <meta charset="utf-8">\n <title>Countries of the World: A Simple Example | Scrape This Site | A public sandbox for learning web scraping</title>\n <link rel="icon" type="image/png" href="/static/images/scraper-icon.png" />\n\n <meta name="viewport" content="width=device-width, initial-scale=1.0">\n <meta name="description" content="A single page that lists information about all the countries in the world. Good for those just get started with web scraping.">\n\n <link href="https://maxcdn.bootstrapcdn.com/bootstrap/3.3.5/css/bootstrap.min.css" rel="stylesheet" integrity="sha256-MfvZlkHCEqatNoGiOXveE8FIwMzZg4W85qfrfIFBfYc= sha512-dTfge/zgoMYpP7QbHy4gWMEGsbsdZeCXz7irItjcC3sPUFtf0kuFbDz/ixG7ArTxmDjLXDmezHubeNikyKGVyQ==" crossorigin="anonymous">\n <link href=\'https://fonts.googleapis.com/css?family=Lato:400,700\' rel=\'stylesheet\' type=\'text/css\'>\n <link rel="stylesheet" type="text/css" href="/static/css/styles.css">\n\n \n<meta name='
Now, let’s use Beautiful Soup to process this HTML. BeautifulSoup()
takes a second argument where we’ll tell it we want to parse HTML, as
opposed to other formats.
soup = BeautifulSoup(html, 'html.parser')
If we print soup.prettify(), we can see the HTML in a structured
format.
print(soup.prettify())
<!DOCTYPE html>
 <html lang="en">
 <head>
 <meta charset="utf-8"/>
 <title>
  Countries of the World: A Simple Example | Scrape This Site | A public sandbox for learning web scraping
 </title>
 <link href="/static/images/scraper-icon.png" rel="icon" type="image/png"/>
 <meta content="width=device-width, initial-scale=1.0" name="viewport"/>
 <meta content="A single page that lists information about all the countries in the world. Good for those just get started with web scraping." name="description"/>
 <link crossorigin="anonymous" href="https://maxcdn.bootstrapcdn.com/bootstrap/3.3.5/css/bootstrap.min.css" integrity="sha256-MfvZlkHCEqatNoGiOXveE8FIwMzZg4W85qfrfIFBfYc= sha512-dTfge/zgoMYpP7QbHy4gWMEGsbsdZeCXz7irItjcC3sPUFtf0kuFbDz/ixG7ArTxmDjLXDmezHubeNikyKGVyQ==" rel="stylesheet"/>
 <link href="https://fonts.googleapis.com/css?family=Lato:400,700" rel="stylesheet" type="text/css"/>
 <link href="/static/css/styles.css" rel="stylesheet" type="text/css"/>
 <meta content="noindex
In HTML, tags define structure. For example, the text of a page lives in the body tag:
<body>
    ...
</body>
Tags come in pairs: opening tags and closing tags. Both use angled
brackets (<>) but closing brackets also use a forward slash
(</>). Tags can contain content in a single line
(<tag>content</tag>) or across multiple lines like above.
Common tags: https://www.geeksforgeeks.org/html-tags-a-to-z-list/
API - U.S. Bureau of Labor Statistics
Another way to extract data from websites is using APIs (Application Programming Interfaces) that some websites provide. https://www.programmableweb.com/apis
APIs are “intermediaries” that allow one software to talk to another. Keep in mind that most APIs have limited usage policies. We will use the U.S. Bureau of Labor Statistics’ API to extract data. They have two API’s, one of which we can use without registration to get several years of data. We will be using this version: BLS Public Data API Signatures (Version 1.0).
If you are intested in this API, you can register for a more powerful API with greater access to data.
Disclaimer: BLS.gov cannot vouch for the data or analyses derived from these data after the data have been retrieved from BLS.gov.
This API, as well as many others, works with a data format called JSON.
JSON looks and acts similarly to a Python dictionary, and we can
interact with it with the json library.
import json
The BLS has many data sets to choose from. We are going to use one on civilian unemployment.
To interact with the API, instead of using requests.get(), we’ll use
requests.post(). The data
series we are looking at
is labeled as LNS13000000 and contains seasonally-adjusted civilian
umemployment. We also will interact with a API-specific URL.
The post will need two other arguments besides the URL to work. We’ll provide headers, which provides the website some information about the format we want the data in. We’ll also provide some data about the data we want, specifically a series ID and year ranges for the data.
json.dumps() converts a Python dictionary into a json object, while
json.loads() does the opposite.
headers = {'Content-type': 'application/json'}
# civilian unemployment query
post_json = {"seriesid": ['LNS13000000'], "startyear":"2015", "endyear":"2024"}

data = json.dumps(post_json)
p = requests.post('https://api.bls.gov/publicAPI/v1/timeseries/data/', data=data, headers=headers)
json_data = json.loads(p.text)

json_data
{'status': 'REQUEST_SUCCEEDED',
 'responseTime': 175,
 'message': [],
 'Results': {'series': [{'seriesID': 'LNS13000000',
    'data': [{'year': '2024',
      'period': 'M08',
      'periodName': 'August',
      'latest': 'true',
      'value': '7115',
      'footnotes': [{}]},
     {'year': '2024',
      'period': 'M07',
      'periodName': 'July',
      'value': '7163',
      'footnotes': [{}]},
     {'year': '2024',
      'period': 'M06',
      'periodName': 'June',
      'value': '6811',
      'footnotes': [{}]},
     {'year': '2024',
      'period': 'M05',
      'periodName': 'May',
      'value': '6649',
      'footnotes': [{}]},
     {'year': '2024',
      'period': 'M04',
      'periodName': 'April',
      'value': '6492',
      'footnotes': [{}]},
     {'year': '2024',
      'period': 'M03',
      'periodName': 'March',
      'value': '6429',
      'footnotes': [{}]},
     {'year': '2024',
      'period': 'M02',
      'periodName': 'February',
      'value': '6458',
      'footnotes': [{}]},
     {'year': '2024',
      'period': 'M01',
      'periodName': 'January',
      'value': '6124',
      'footnotes': [{}]},
     {'year': '2023',
      'period': 'M12',
      'periodName': 'December',
      'value': '6268',
      'footnotes': [{}]},
     {'year': '2023',
      'period': 'M11',
      'periodName': 'November',
      'value': '6262',
      'footnotes': [{}]},
     {'year': '2023',
      'period': 'M10',
      'periodName': 'October',
      'value': '6443',
      'footnotes': [{}]},
     {'year': '2023',
      'period': 'M09',
      'periodName': 'September',
      'value': '6347',
      'footnotes': [{}]},
     {'year': '2023',
      'period': 'M08',
      'periodName': 'August',
      'value': '6340',
      'footnotes': [{}]},
     {'year': '2023',
      'period': 'M07',
      'periodName': 'July',
      'value': '5904',
      'footnotes': [{}]},
     {'year': '2023',
      'period': 'M06',
      'periodName': 'June',
      'value': '5997',
      'footnotes': [{}]},
     {'year': '2023',
      'period': 'M05',
      'periodName': 'May',
      'value': '6117',
      'footnotes': [{}]},
     {'year': '2023',
      'period': 'M04',
      'periodName': 'April',
      'value': '5715',
      'footnotes': [{}]},
     {'year': '2023',
      'period': 'M03',
      'periodName': 'March',
      'value': '5866',
      'footnotes': [{}]},
     {'year': '2023',
      'period': 'M02',
      'periodName': 'February',
      'value': '5962',
      'footnotes': [{}]},
     {'year': '2023',
      'period': 'M01',
      'periodName': 'January',
      'value': '5719',
      'footnotes': [{}]},
     {'year': '2022',
      'period': 'M12',
      'periodName': 'December',
      'value': '5698',
      'footnotes': [{}]},
     {'year': '2022',
      'period': 'M11',
      'periodName': 'November',
      'value': '5956',
      'footnotes': [{}]},
     {'year': '2022',
      'period': 'M10',
      'periodName': 'October',
      'value': '5950',
      'footnotes': [{}]},
     {'year': '2022',
      'period': 'M09',
      'periodName': 'September',
      'value': '5755',
      'footnotes': [{}]},
     {'year': '2022',
      'period': 'M08',
      'periodName': 'August',
      'value': '5983',
      'footnotes': [{}]},
     {'year': '2022',
      'period': 'M07',
      'periodName': 'July',
      'value': '5783',
      'footnotes': [{}]},
     {'year': '2022',
      'period': 'M06',
      'periodName': 'June',
      'value': '5984',
      'footnotes': [{}]},
     {'year': '2022',
      'period': 'M05',
      'periodName': 'May',
      'value': '5966',
      'footnotes': [{}]},
     {'year': '2022',
      'period': 'M04',
      'periodName': 'April',
      'value': '6034',
      'footnotes': [{}]},
     {'year': '2022',
      'period': 'M03',
      'periodName': 'March',
      'value': '5993',
      'footnotes': [{}]},
     {'year': '2022',
      'period': 'M02',
      'periodName': 'February',
      'value': '6279',
      'footnotes': [{}]},
     {'year': '2022',
      'period': 'M01',
      'periodName': 'January',
      'value': '6549',
      'footnotes': [{}]},
     {'year': '2021',
      'period': 'M12',
      'periodName': 'December',
      'value': '6305',
      'footnotes': [{}]},
     {'year': '2021',
      'period': 'M11',
      'periodName': 'November',
      'value': '6733',
      'footnotes': [{}]},
     {'year': '2021',
      'period': 'M10',
      'periodName': 'October',
      'value': '7244',
      'footnotes': [{}]},
     {'year': '2021',
      'period': 'M09',
      'periodName': 'September',
      'value': '7659',
      'footnotes': [{}]},
     {'year': '2021',
      'period': 'M08',
      'periodName': 'August',
      'value': '8288',
      'footnotes': [{}]},
     {'year': '2021',
      'period': 'M07',
      'periodName': 'July',
      'value': '8770',
      'footnotes': [{}]},
     {'year': '2021',
      'period': 'M06',
      'periodName': 'June',
      'value': '9547',
      'footnotes': [{}]},
     {'year': '2021',
      'period': 'M05',
      'periodName': 'May',
      'value': '9250',
      'footnotes': [{}]},
     {'year': '2021',
      'period': 'M04',
      'periodName': 'April',
      'value': '9801',
      'footnotes': [{}]},
     {'year': '2021',
      'period': 'M03',
      'periodName': 'March',
      'value': '9734',
      'footnotes': [{}]},
     {'year': '2021',
      'period': 'M02',
      'periodName': 'February',
      'value': '9992',
      'footnotes': [{}]},
     {'year': '2021',
      'period': 'M01',
      'periodName': 'January',
      'value': '10196',
      'footnotes': [{}]},
     {'year': '2020',
      'period': 'M12',
      'periodName': 'December',
      'value': '10772',
      'footnotes': [{}]},
     {'year': '2020',
      'period': 'M11',
      'periodName': 'November',
      'value': '10713',
      'footnotes': [{}]},
     {'year': '2020',
      'period': 'M10',
      'periodName': 'October',
      'value': '11012',
      'footnotes': [{}]},
     {'year': '2020',
      'period': 'M09',
      'periodName': 'September',
      'value': '12573',
      'footnotes': [{}]},
     {'year': '2020',
      'period': 'M08',
      'periodName': 'August',
      'value': '13498',
      'footnotes': [{}]},
     {'year': '2020',
      'period': 'M07',
      'periodName': 'July',
      'value': '16391',
      'footnotes': [{}]},
     {'year': '2020',
      'period': 'M06',
      'periodName': 'June',
      'value': '17658',
      'footnotes': [{}]},
     {'year': '2020',
      'period': 'M05',
      'periodName': 'May',
      'value': '20933',
      'footnotes': [{}]},
     {'year': '2020',
      'period': 'M04',
      'periodName': 'April',
      'value': '23090',
      'footnotes': [{}]},
     {'year': '2020',
      'period': 'M03',
      'periodName': 'March',
      'value': '7209',
      'footnotes': [{}]},
     {'year': '2020',
      'period': 'M02',
      'periodName': 'February',
      'value': '5729',
      'footnotes': [{}]},
     {'year': '2020',
      'period': 'M01',
      'periodName': 'January',
      'value': '5842',
      'footnotes': [{}]},
     {'year': '2019',
      'period': 'M12',
      'periodName': 'December',
      'value': '5853',
      'footnotes': [{}]},
     {'year': '2019',
      'period': 'M11',
      'periodName': 'November',
      'value': '5868',
      'footnotes': [{}]},
     {'year': '2019',
      'period': 'M10',
      'periodName': 'October',
      'value': '5871',
      'footnotes': [{}]},
     {'year': '2019',
      'period': 'M09',
      'periodName': 'September',
      'value': '5753',
      'footnotes': [{}]},
     {'year': '2019',
      'period': 'M08',
      'periodName': 'August',
      'value': '5945',
      'footnotes': [{}]},
     {'year': '2019',
      'period': 'M07',
      'periodName': 'July',
      'value': '6061',
      'footnotes': [{}]},
     {'year': '2019',
      'period': 'M06',
      'periodName': 'June',
      'value': '5935',
      'footnotes': [{}]},
     {'year': '2019',
      'period': 'M05',
      'periodName': 'May',
      'value': '5930',
      'footnotes': [{}]},
     {'year': '2019',
      'period': 'M04',
      'periodName': 'April',
      'value': '5961',
      'footnotes': [{}]},
     {'year': '2019',
      'period': 'M03',
      'periodName': 'March',
      'value': '6202',
      'footnotes': [{}]},
     {'year': '2019',
      'period': 'M02',
      'periodName': 'February',
      'value': '6136',
      'footnotes': [{}]},
     {'year': '2019',
      'period': 'M01',
      'periodName': 'January',
      'value': '6475',
      'footnotes': [{}]},
     {'year': '2018',
      'period': 'M12',
      'periodName': 'December',
      'value': '6389',
      'footnotes': [{}]},
     {'year': '2018',
      'period': 'M11',
      'periodName': 'November',
      'value': '6115',
      'footnotes': [{}]},
     {'year': '2018',
      'period': 'M10',
      'periodName': 'October',
      'value': '6211',
      'footnotes': [{}]},
     {'year': '2018',
      'period': 'M09',
      'periodName': 'September',
      'value': '6073',
      'footnotes': [{}]},
     {'year': '2018',
      'period': 'M08',
      'periodName': 'August',
      'value': '6156',
      'footnotes': [{}]},
     {'year': '2018',
      'period': 'M07',
      'periodName': 'July',
      'value': '6195',
      'footnotes': [{}]},
     {'year': '2018',
      'period': 'M06',
      'periodName': 'June',
      'value': '6447',
      'footnotes': [{}]},
     {'year': '2018',
      'period': 'M05',
      'periodName': 'May',
      'value': '6196',
      'footnotes': [{}]},
     {'year': '2018',
      'period': 'M04',
      'periodName': 'April',
      'value': '6459',
      'footnotes': [{}]},
     {'year': '2018',
      'period': 'M03',
      'periodName': 'March',
      'value': '6472',
      'footnotes': [{}]},
     {'year': '2018',
      'period': 'M02',
      'periodName': 'February',
      'value': '6581',
      'footnotes': [{}]},
     {'year': '2018',
      'period': 'M01',
      'periodName': 'January',
      'value': '6489',
      'footnotes': [{}]},
     {'year': '2017',
      'period': 'M12',
      'periodName': 'December',
      'value': '6632',
      'footnotes': [{}]},
     {'year': '2017',
      'period': 'M11',
      'periodName': 'November',
      'value': '6774',
      'footnotes': [{}]},
     {'year': '2017',
      'period': 'M10',
      'periodName': 'October',
      'value': '6700',
      'footnotes': [{}]},
     {'year': '2017',
      'period': 'M09',
      'periodName': 'September',
      'value': '6854',
      'footnotes': [{}]},
     {'year': '2017',
      'period': 'M08',
      'periodName': 'August',
      'value': '7082',
      'footnotes': [{}]},
     {'year': '2017',
      'period': 'M07',
      'periodName': 'July',
      'value': '6892',
      'footnotes': [{}]},
     {'year': '2017',
      'period': 'M06',
      'periodName': 'June',
      'value': '6873',
      'footnotes': [{}]},
     {'year': '2017',
      'period': 'M05',
      'periodName': 'May',
      'value': '7000',
      'footnotes': [{}]},
     {'year': '2017',
      'period': 'M04',
      'periodName': 'April',
      'value': '7089',
      'footnotes': [{}]},
     {'year': '2017',
      'period': 'M03',
      'periodName': 'March',
      'value': '7073',
      'footnotes': [{}]},
     {'year': '2017',
      'period': 'M02',
      'periodName': 'February',
      'value': '7379',
      'footnotes': [{}]},
     {'year': '2017',
      'period': 'M01',
      'periodName': 'January',
      'value': '7468',
      'footnotes': [{}]},
     {'year': '2016',
      'period': 'M12',
      'periodName': 'December',
      'value': '7521',
      'footnotes': [{}]},
     {'year': '2016',
      'period': 'M11',
      'periodName': 'November',
      'value': '7553',
      'footnotes': [{}]},
     {'year': '2016',
      'period': 'M10',
      'periodName': 'October',
      'value': '7811',
      'footnotes': [{}]},
     {'year': '2016',
      'period': 'M09',
      'periodName': 'September',
      'value': '7953',
      'footnotes': [{}]},
     {'year': '2016',
      'period': 'M08',
      'periodName': 'August',
      'value': '7784',
      'footnotes': [{}]},
     {'year': '2016',
      'period': 'M07',
      'periodName': 'July',
      'value': '7641',
      'footnotes': [{}]},
     {'year': '2016',
      'period': 'M06',
      'periodName': 'June',
      'value': '7744',
      'footnotes': [{}]},
     {'year': '2016',
      'period': 'M05',
      'periodName': 'May',
      'value': '7652',
      'footnotes': [{}]},
     {'year': '2016',
      'period': 'M04',
      'periodName': 'April',
      'value': '8067',
      'footnotes': [{}]},
     {'year': '2016',
      'period': 'M03',
      'periodName': 'March',
      'value': '7961',
      'footnotes': [{}]},
     {'year': '2016',
      'period': 'M02',
      'periodName': 'February',
      'value': '7702',
      'footnotes': [{}]},
     {'year': '2016',
      'period': 'M01',
      'periodName': 'January',
      'value': '7627',
      'footnotes': [{}]},
     {'year': '2015',
      'period': 'M12',
      'periodName': 'December',
      'value': '7907',
      'footnotes': [{}]},
     {'year': '2015',
      'period': 'M11',
      'periodName': 'November',
      'value': '8000',
      'footnotes': [{}]},
     {'year': '2015',
      'period': 'M10',
      'periodName': 'October',
      'value': '7922',
      'footnotes': [{}]},
     {'year': '2015',
      'period': 'M09',
      'periodName': 'September',
      'value': '7907',
      'footnotes': [{}]},
     {'year': '2015',
      'period': 'M08',
      'periodName': 'August',
      'value': '7992',
      'footnotes': [{}]},
     {'year': '2015',
      'period': 'M07',
      'periodName': 'July',
      'value': '8167',
      'footnotes': [{}]},
     {'year': '2015',
      'period': 'M06',
      'periodName': 'June',
      'value': '8247',
      'footnotes': [{}]},
     {'year': '2015',
      'period': 'M05',
      'periodName': 'May',
      'value': '8834',
      'footnotes': [{}]},
     {'year': '2015',
      'period': 'M04',
      'periodName': 'April',
      'value': '8550',
      'footnotes': [{}]},
     {'year': '2015',
      'period': 'M03',
      'periodName': 'March',
      'value': '8515',
      'footnotes': [{}]},
     {'year': '2015',
      'period': 'M02',
      'periodName': 'February',
      'value': '8599',
      'footnotes': [{}]},
     {'year': '2015',
      'period': 'M01',
      'periodName': 'January',
      'value': '8885',
      'footnotes': [{}]}]}]}}
We can use a similar pipeline as we did above to get the json data into a pandas dictionary.
pandas_data = {
    'seriesId': [],
    'year': [],
    'period': [],
    'value': []
}

for series in json_data['Results']['series']:

    seriesId = series['seriesID']

    for item in series['data']:
        year = item['year']
        period = item['period']
        value = item['value']

        pandas_data['seriesId'].append(seriesId)
        pandas_data['year'].append(year)
        pandas_data['period'].append(period)
        pandas_data['value'].append(value)
Let’s convert our dictionary into a pandas DataFrame and take a look at it.
df = pd.DataFrame(pandas_data)
df.head()
seriesId |
year |
period |
value |
|
|---|---|---|---|---|
0 |
LNS13000000 |
2024 |
M08 |
7115 |
1 |
LNS13000000 |
2024 |
M07 |
7163 |
2 |
LNS13000000 |
2024 |
M06 |
6811 |
3 |
LNS13000000 |
2024 |
M05 |
6649 |
4 |
LNS13000000 |
2024 |
M04 |
6492 |
When you are loading data from a website, it can sometimes be a good
idea to check how the data loaded into pandas. For instance, sometimes
numerical variables are treated as categorical variables. We can the
data type of our columns with df.dtypes.
df.dtypes
seriesId     object
year         object
period       object
value        object
footnotes    object
dtype: object
It looks like 'year' and 'value' are currently object columns,
which means they will be treated as strings. We can change the column by
using .astype('int64') and re-assigning the output to our columns.
'int64' is a pandas-specific data type for integer values.
df['year'] = df['year'].astype('int64')
df['value'] = df['value'].astype('int64')
df.dtypes
seriesId     object
year          int64
period       object
value         int64
footnotes    object
dtype: object
Now that we’ve fixed the data types of our variables, we’re going to
summarize citizen employment unemployment by year. To do this, we can
group our data by year with .groupby() and then calculating the
mean.
year_groups = df.groupby('year')
unemployment_by_year = year_groups['value'].mean()
unemployment_by_year
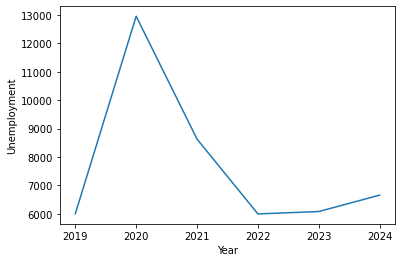
year
2019     5999.166667
2020    12951.666667
2021     8626.583333
2022     5994.166667
2023     6078.333333
2024     6655.125000
Name: value, dtype: float64
When you produce a summary of a grouped DataFrame, you can use
.reset_index() to turn it back into a standard, non-grouped data
frame.
unemployment_by_year_df = unemployment_by_year.reset_index()
unemployment_by_year_df
year |
value |
|---|---|
2019 |
5999.166667 |
2020 |
12951.666667 |
2021 |
8626.583333 |
2022 |
5994.166667 |
2023 |
6078.333333 |
2024 |
6655.125000 |
Now, let’s use matplotlib to plot the change in civilian unemployment over the last few years.
import matplotlib.pyplot as plt
import seaborn as sns

fig, ax = plt.subplots()
ax.plot(unemployment_by_year_df['year'], unemployment_by_year_df['value'])
ax.set_xlabel('Year')
ax.set_ylabel('Unemployment')
plt.show()
Finally, we can save our unemployment data for future use or storage.
df.to_csv('output.csv')
Resources
User identifying agents: https://www.zenrows.com/blog/python-requests-user-agent#what-is
Navigate Javascript and logins with Selenium: https://selenium-python.readthedocs.io/index.html